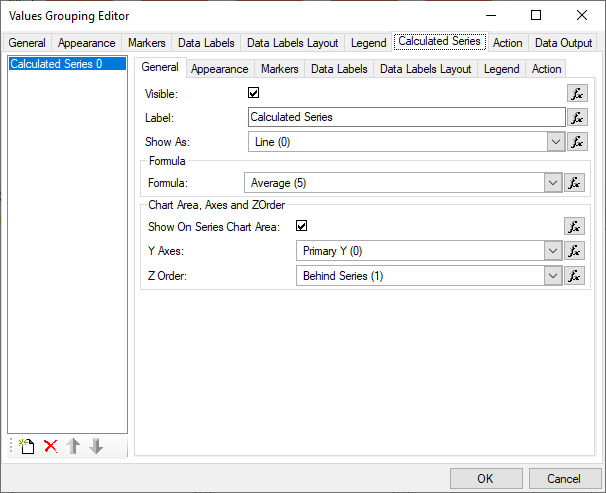
The general properties of the calculated series are:
Visible - controls the visibility of the calculated series.
Label - controls the label of the calculated series. The label is usually shown in the legend.
Show As - controls the way in which the calculated series are visualized. Possible values are:
Line - the calculated series are displayed as line.
Area - the calculated series are displayed as an area.
Smooth Line - the calculated series are displayed as a smooth line.
Smooth Area - the calculated series are displayed as a smooth area.
Formula - controls the formula that is used to extract values from the master series. The report item defines the following formulas:
| Formula | Description | Parameters |
|---|---|---|
|
Statistical - General |
||
| Min | Calculates the minimal of all master series values. | |
| Max | Calculates the maximum of all master series values. | |
| Median | Calculates the median of all master series values. | |
| Cumulative | Calculates the cumulative sum of the elements in the master series values. Each element of the result is equal to the previous element of the result plus the current element of master series values. | |
| Sum | Calculates the sum of all master series values. | |
| Average | Calculates the average of all master series values. | |
| Exponential Average | Calculates the exponential average of all master series values. | Weight - the 'weight' parameter is the exponential weight - a constant between 0 and 1. |
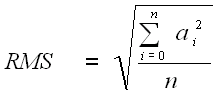
| Root Mean Square |
Calculates the RMS of the of the master series values. The RMS is calculated via the following formula:
|
|
| Standard Deviation | Standard deviation is used to indicate volatility, and measures the difference between values and their average. The function calculates the standard deviation for the elements in the master series values array. If the 'period' parameter is supplied the function calculates a "moving" standard deviation with the specified period (standard deviation with simple moving average). | Period - the 'period' defines the period for the function - it must be a constant greater or equal to 1. |
| Linear Regression | Calculates the linear regression of the master series values. The calculation takes into account the X values of master series. If the master series is an XY scatter, you have the option to control whether the regression line is draw from the min to max X value (if UseXMinMax is checked) or from the first to the last item in the data set. | UseXMinMax - if the master series is an XY scatter, determines whether the regression line is drawn from min to the max x value or from the first to the last X value of the master series. |
| Power Regression | Calculates the regression of the master series values. The calculation takes into account the X values of master series. | |
| Logarithmic Regression | Calculates the logarithmic regression of the master series values. The calculation takes into account the X values of master series. | |
| Exponential Regression | Calculates the exponential regression of the master series values. The calculation takes into account the X values of master series. | |
| Polynomial Regression | Calculates the polynomial regression of the master series values. The calculation takes into account the X values of master series. You have the option to control the polynomial order and thus create polynomial interpolations of second, third and higher degrees. | Polynomial Order - an integer value larger or equal to 2, that defines the degree of the polynomial regression. |
| Statistical - Range Indicators | ||
| Bollinger Bands |
Bollinger bands are displayed at a given number of standard deviations from a moving average of a price. Since standard deviation is a measure of volatility, the bands are self-adjusting: widening during volatile markets and contracting during calmer periods. Bollinger Bands were created by John Bollinger. To display the two Bollinger bands you can use two line series (one for the upper band and one for the lower band) or a single Hi-Low series. Mr. Bollinger recommends using 20 for the number of periods in the moving average, and using 2 standard deviations. He has also found that moving averages of less then 10 periods do not work very well. |
Period - the 'period' defines the period for the function - it must be a constant greater or equal to 1. Deviation - the 'deviation' defines the number of standard deviations the band is offset from the simple moving average of 'values'. For the upper band this must be a positive value and for the lower band - a negative value. |
| Envelopes | Price envelopes are plotted at a specified percentage above and below a moving average. They are used to indicate overbought and oversold levels. The shift percentage should be set so that about 90% of price activity is contained within the bands. Adjust the band width if volatility increases over time. |
Period - the 'period' defines the period for the function - it must be a constant greater or equal to 1. Shift - the 'shift' defines the offset from the simple moving average of 'values' in percents. For the upper band this must be a positive value and for the lower band - a negative value. |
|
Statistical - Moving Averages |
||
| Simple Moving Average | A Moving Average is an indicator that shows the average value of a security's price over a period of time. A simple, or arithmetic, moving average is calculated by adding the price of the security for a number of time periods (e.g., 12 days) and then dividing this total by the number of time periods. The result is the average price of the security over the time period. Simple moving averages give equal weight to each daily price. |
Period - the 'period' defines the period for the function - it must be a constant greater or equal to 1. |
| Weighted Moving Average | A Moving Average is an indicator that shows the average value of a security's price over a period of time. A weighted moving average is designed to put more weight on recent data and less weight on past data. A weighted moving average is calculated by multiplying each of the previous day's data by a weight (the weight is the index of the data). |
Period - the 'period' defines the period for the function - it must be a constant greater or equal to 1. |
| Exponential Moving Average |
A Moving Average is an indicator that shows the average value of a security's price over a period of time. An exponential (or exponentially weighted) moving average is calculated by applying a percentage of today's price to yesterday's moving average value. Exponential moving averages place more weight on recent prices. The formula of the exponential moving average is:
|
Period - the 'period' defines the period for the function - it must be a constant greater or equal to 1. |
| Modified Moving Average |
A Moving Average is an indicator that shows the average value of a security's price over a period of time. The Modified Moving Average is actually the same as the Exponential Moving Average, but with one difference - the exponential percentage is calculated with the following formula:
|
|
|
Financial - Price Indicators |
||
| Median Price |
Median Price is the mid-point of the trading range. It can be used as a filter for trend indicators. The median price for each day is calculated using the following formula: MP = (high + low) / 2 |
|
| Typical Price |
Typical Price is an approximation of average price for each period and can be used as a filter for moving average systems. The formula of the Typical Price is: TP = (close + high + low) / 3 |
|
| WeightedClose |
The Weighted Close indicator calculates the daily average of Hi, Low and Close prices. It is designed to put more weight on the Close values. The formula of the Weighted Close is: WC = (2 * close + high + low) / 4 |
|
|
Financial - Directional Movement |
||
| Positive Direction Indicator | The +DI function is a part of the Directional Movement System developed by J. Welles Wilder. The system consists of three lines: - The Positive Direction Indicator (+DI) summarizes upward trend movement; - The Negative Direction Indicator (-DI) summarizes downward trend movement; - The Average Directional Movement Index (ADX) indicates whether the market is trending or ranging. For internal calculations the DI_POS function uses the modified moving average. |
Period - the 'period' defines the period for the function - it must be a constant greater or equal to 1. |
| Negative Direction Indicator | The -DI function is a part of the Directional Movement System developed by J. Welles Wilder. The system consists of three lines: - The Positive Direction Indicator (+DI) summarizes upward trend movement; - The Negative Direction Indicator (-DI) summarizes downward trend movement; - The Average Directional Movement Index (ADX) indicates whether the market is trending or ranging. For internal calculations the DI_NEG function uses the modified moving average. |
Period - the 'period' defines the period for the function - it must be a constant greater or equal to 1. |
| Directional Movement Index | The Average Directional Movement is a part of the Directional Movement System developed by J. Welles Wilder. The system consists of three lines: - The Positive Direction Indicator (+DI) summarizes upward trend movement; - The Negative Direction Indicator (-DI) summarizes downward trend movement; - The Average Directional Movement Index (ADX) indicates whether the market is trending or ranging. Declining ADX shows that the market is losing direction. When ADX falls below both +DI and -DI it signals a lifeless market. When ADX rises above both +DI and -DI it signals that the market is becoming overheated. The ADX is defined as a moving average of the Directional Movement Index. By default, the Modified Moving Average is used for smoothing with a period of 14 days. You can use another type of moving average by changing the original formula. |
Period - the 'period' defines the period for the function - it must be a constant greater or equal to 1. |
| Average Directional Movement | The Average Directional Movement is a part of the Directional Movement System developed by J. Welles Wilder. The system consists of three lines: - The Positive Direction Indicator (+DI) summarizes upward trend movement; - The Negative Direction Indicator (-DI) summarizes downward trend movement; - The Average Directional Movement Index (ADX) indicates whether the market is trending or ranging. Declining ADX shows that the market is losing direction. When ADX falls below both +DI and -DI it signals a lifeless market. When ADX rises above both +DI and -DI it signals that the market is becoming overheated. The ADX is defined as a moving average of the Directional Movement Index. By default, the Modified Moving Average is used for smoothing with a period of 14 days. You can use another type of moving average by changing the original formula. |
Period - the 'period' defines the period for the function - it must be a constant greater or equal to 1. |
|
Financial - Technical Indicators |
||
| Average True Range |
Average True Range is an indicator from J. Welles Wilder that measures commitment by comparing the range for each successive day. The True Range indicator is the greatest of the following: The Average True Range is a moving average (typically 14-days) of the True Range. |
Period - the 'period' defines the period for the function - it must be a constant greater or equal to 1. |
| Chaikins Volatility | The Chaikin Volatility function determines the volatility of a security using the percentage change in a moving average of the high versus low price over a given time period. It is most useful in conjunction with a moving average system or price envelopes. |
Period - the rate of change period. The recommended value is 10.
|
| Commodity Channel Index | The Commodity Channel Index measures the position of price in relation to its moving average. It is used to highlight when the market is overbought/oversold or to signal when a trend is weakening. The indicator is similar in concept to Bollinger Bands but is presented as an indicator line rather than as a range. The Commodity Channel Index was developed by Donald Lambert. |
Period - the 'period' defines the period for the function - it must be a constant greater or equal to 1. |
| Detrended Price Oscillator | The Detrended Price Oscillator compares the closing price (or any other price) to a prior moving average. This indicator attempts to eliminate the trend in prices. Detrended prices allow you to more easily identify cycles and overbought/oversold levels. |
Period - the 'period' defines the period for the function - it must be a constant greater or equal to 1. |
| Mass Index | The Mass Index was designed to identify trend reversals by measuring the narrowing and widening of the trading range (high - low prices). As the range widens the Mass Index increases; as the range narrows the Mass Index decreases. The Mass Index was invented by Donald Dorsey. |
Period - is the accumulation period. The recommended value is 25
|
| Momentum |
The Momentum indicator measures the amount that a security's price has changed over a given time span. It can be used as a trend-following oscillator similar to the MACD or as a leading indicator. The formula of the momentum is: Momentum[n] = values[n] - values[n - period] |
Period - the 'period' defines the period for the function - it must be a constant greater or equal to 1. |
| Momentum Division |
The Momentum Division function is similar to the Momentum indicator. It calculates the ratio between a current value and the value, which is 'period' days before the current value. The formula of the Momentum Division is: MomentumDiv[n] = 100 * values[n] / values[n - period] |
Period - the 'period' defines the period for the function - it must be a constant greater or equal to 1. |
| Moving Average Convergence Divergence |
The Moving Average Convergence Divergence (MACD) is a trend following momentum indicator that shows the relationship between two moving averages of prices. It is calculated by subtracting the value of a 26-day exponential moving average from a 12-day exponential moving average. The MACD proves most effective in wide-swinging trading markets. In a market which is accelerating upwards, the short moving average will rise faster than the longer moving average. This will lead to a rising MACD. In a market which is accelerating downwards, the short moving average will fall faster than the longer moving average. This will lead to a falling MACD. The MACD was developed by Gerald Appel. |
|
| Performance | The Performance indicator displays a security's price performance as a percentage. This is sometimes also called a normalized chart, as it enables to compare shares with differing price levels. The Performance indicator compares a current price value with the value from the first time period. | |
| Rate Of Change |
The Rate of Change indicator monitors market momentum. It calculates the market's rate of change relative to previous trading intervals. The Rate of Change indicator is calculated using the following formula: ROC = ((Today's value - Value n periods ago) / (Value n periods ago)) * 100 |
|
| Relative Strength Index |
Relative Strength Index (RSI) is a popular momentum oscillator developed by J. Welles Wilder. The Relative Strength Index compares upward movements in closing price to downward movements over a selected period. The RSI ranges between 0 and 100. The formula of the RSI is: RSI[n] = 100 - (100 / (1 + U[n] / D[n])) where: Relative Strength Index is smoother than the Momentum or Rate of Change oscillators and is not as susceptible to distortion from unusually high or low prices at the start of the window. |
Period - the 'period' defines the period for the function - it must be a constant greater or equal to 1. |
| Stochastic Oscillator |
The Stochastic Oscillator compares where a security's price closed relative to its price range over a given time period. The Simple Stochastic Indicator (%K) is calculated using the following formula: %K = 100 * (Today's close - LL) / (HH - LL) LL is the current lowest low value for the given time period. HH is the current highest high value for the given time period. The Smoothed Stochastic Indicator (%D) is calculated as a Moving Average of %K. For example you can use the following expression: SMA( STOCHASTIC(close; high; low; 10); 10 ) |
Period - the 'period' defines the period for the function - it must be a constant greater or equal to 1. |
| TRIX | The TRIX indicator is based on a triple exponential moving average of the closing price and is designed to filter out insignificant cycles and show the prevailing trend of the stock. Triple smoothing reduces volatility and minimizes the chance of false signals. |
Period - the 'period' defines the period for the function - it must be a constant greater or equal to 1. |
| True Range | The True Range indicator is the greatest of the following: - High for the day minus Low for the day. - The absolute value of: High for the day minus Close for the previous day. - The absolute value of: Low for the day minus Close for the previous day. |
|
| Williams Percent R | William's %R is a momentum indicator, designed to measure overbought and oversold levels. This indicator is similar to the Stochastic %K indicator, except that Williams %R is plotted using negative values ranging from 0 to -100. This indicator was developed by Larry Williams. |
Period - the 'period' defines the period for the function - it must be a constant greater or equal to 1. |
Show On Series Chart Area - when set to true the calculated series are displayed on the chart area on which the master series are displayed. When set to false the calculated series are displayed on the chart area specified by the Chart Area combo. By default set to true.
Chart Area - lets you choose the chart area on which to display the calculated series. Only applicable if Show On Series Chart Area is false.
Y Axes - lets you specify the Y axis on which to scale the calculated series.
Z Order - controls the Z order of the calculated series in regards to the master series and the other series in the respective chart area. Possible values are:
Behind All Series - the calculated series appears "behind" all series in the chart area.
Behind Series - the calculated series appears behind the master series in the chart area. If the calculated series is displayed on a chart area different than that of the master series, this setting is equivalent to Behind All Series.
Before Series - the calculated series appears before the master series in the chart area. If the calculated series is displayed on a chart area different than that of the master series, this setting is equivalent to Before All Series.
Before All Series - the calculated series appears before all series in the chart area.